Last week, we showed you how we touched a chosen balloon with a pushpin without popping it, using trueness. This blog post is the first chapter of a series introducing a new way of characterizing 3D sensing performance for robotic automation and explaining what trueness is.
This is a sample of our white paper "Achieving accuracy in vision-guided robotics". Read it here:

Table of content
- Introduction
- Which of these 3D cameras meets my needs?
- VDI/VDE - the German answer
- Accuracy, precision and trueness and ISO 5725
- Field-of-view (FOV) - the sampling grid
- Sensor resolution
- Spatial resolution
- What about depth resolution?
- Seeing the details
Introduction
At Zivid we pride ourselves on designing, building, and delivering the best 3D color cameras possible. We make our products such that they deliver astonishing results time after time in demanding industrial environments. However, it’s typically easy to just claim these things, and if you search the internet that’s what most camera vendors are saying anyway, so what is it that makes Zivid any different?
As a serious industrial camera manufacturer, we are of course backing all our claims with comprehensive machine vision camera characterizations as part of our datasheets, specifying the guaranteed range of performance of all our cameras. And if you read Zivid datasheets you will quickly realize that we are doing things differently and more thoroughly than what you typically see.
You might also have noticed that we are talking extensively about Trueness, which is a new term to many in the context of this industry. Initially, industry veterans even talked us down calling it ‘marketing lingo’, but after sitting down with them, explaining the same things we are going to explain here, it turned completely around, and they wanted to actively help promote it instead.
We recently held a webinar on the topic – "Trueness – The secret to reliable picking" which had over three hundred registrants and was very well received, with many questions at the end. So, we know the industry is interested in trueness and want to know more, and in more detail - How it came to be and how it all ties together.
What we have done is to introduce a new way of characterizing and specifying 3D camera performance, and this is what this blog series is all about. We will explain the fundamentals of 3D camera accuracy, while simultaneously discussing the thinking and rationale behind the specifications we use for our 3D cameras at Zivid, and how we defined them. While doing so, we will also share some of the insights we have had throughout the journey, which hopefully will bring more clarity and understanding.
Why does the explicit split between precision and trueness inaccuracy makes so much sense in the field of robotic pick and place and how does it compare to 3D camera performance anyway? And how Trueness, or more specifically, low trueness error, is so fundamental to accurate and reliable picking in collaborative robot cells. Understanding the criticality of this feature in the performance of Zivid cameras, having an exceptionally low trueness error. With that in mind, let's get started and dive right into this subject.
Which of these 3D cameras meets my needs?
For a performant robot cell accuracy is what matters, reliable, repeatable accuracy. But what is accuracy, and how is it derived? When Zivid entered the automation field we saw early on it wasn’t a clear cut, and different people called out accuracy and 3D camera performance by different means.
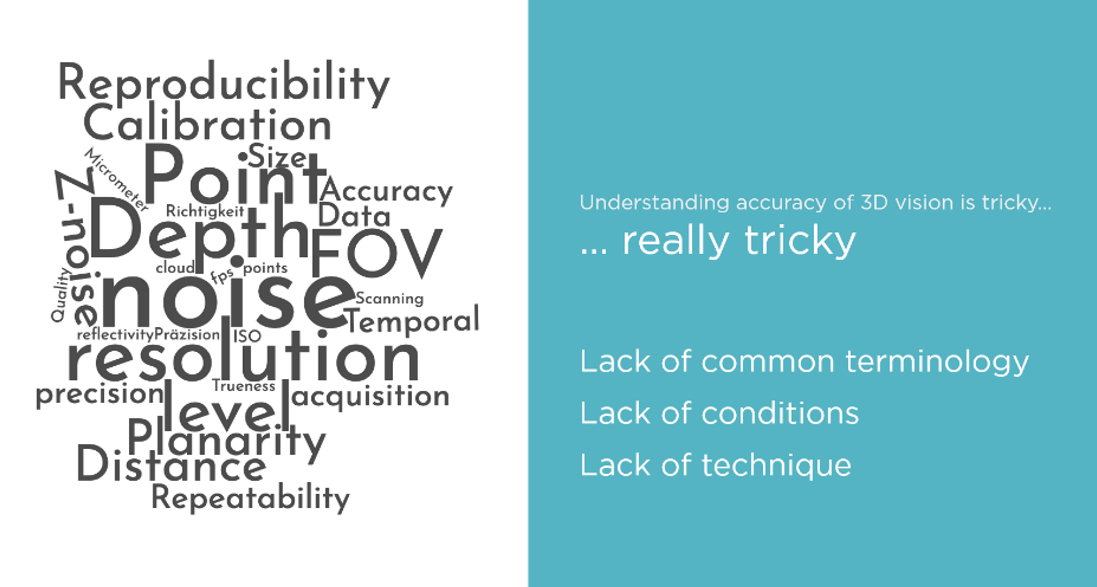
Performance was expressed in all kinds of ways, and from vendor to vendor, there was a lack of common terminologies, a lack of conditions, and technique. It was a confusing scene in the industry even amongst the vision experts, and clearly, it was even more confusing for customers who were not vision specialists. It was clear to us that this wasn’t the way to do it.
We wanted to find a better way to describe 3D camera performance for our industry and our goal was no less than creating 3D camera specifications that could help “democratize 3D” and become a system for easier understanding of the applicability of 3D cameras. Something that would be much more intuitive and user-friendly for automation customers.
VDI/VDE – ‘The German answer’
Looking around for existing standards, the metrology industry had a good, clean means of definition by means of VDI/VDE 2634 and the ISO 10360. These standards originated in the development of coordinate measurement machines (CMMs). The means of definition here was particularly good but it lacked something we wanted, ease of understanding and use of relatable terms to the industries we care about. The terminology in use with CMMs with terms like ‘probing error’ was just too esoteric and didn’t work in an intuitive way for customers by our reckoning. Additionally, and importantly, it also lacked some of the metrics necessary to properly characterize and understand 3D camera performance in robotic applications.
Regardless, we do recognize the value of characterizing performance according to internationally recognized standards. So, even if we are adopting a new way of specifying 3D cameras, we will still adhere to the existing standards in making sure all the important aspects are covered. In our specifications we cover the same but are expanding with new metrics to better fit the target market and applications for our cameras, we are also introducing new more intuitive naming and terminology.
Accuracy, Precision and Trueness and ISO 5725
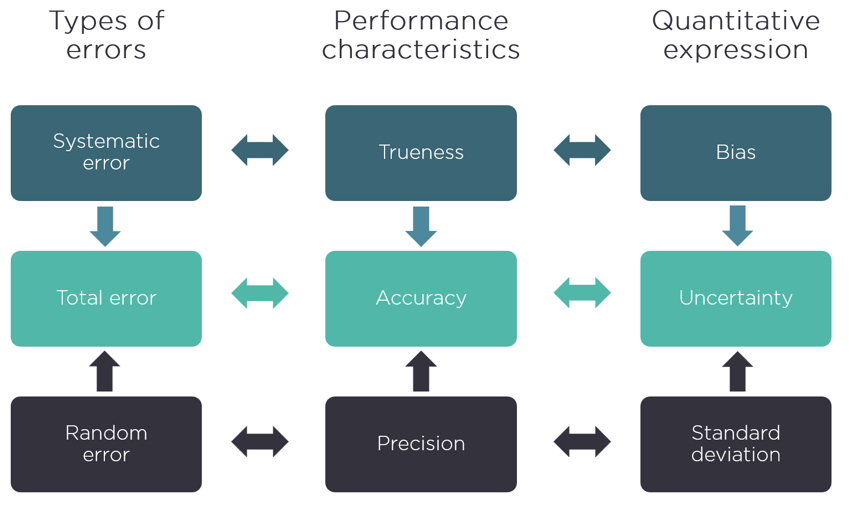
It turned out there was a good place to start already in the form of ISO 5725. The International Standards Organization had seen the need to break out the definition and relationships between accuracy, precision, and trueness. So, here’s how ISO 5725 describes them.
Precision
The closeness of agreement between a set of repeated measurements. Describing random errors, a measure of statistical variability. The standard deviation.
Trueness
The closeness of agreement between the average value (arithmetic mean) of a large set of measurements and a true (or accepted) reference value. Describing systematic errors. A measure of statistical bias
Accuracy
The closeness of agreement between consecutive/repeated measurements, and a true (or accepted) reference value. A combination of both types of observational errors (random and systematic). Describing the total error. A measure of statistical uncertainty. Therefore, high accuracy, our stated goal, demands both high precision and high trueness.
It is worth noting that accuracy had been used for a time already, to describe what was in fact trueness. However, in some contexts, it was also used together with precision describing the total displacement covering both random and systematic effects. Historically, it was therefore important to be careful and explain to potential readers in which sense of the term “measurement accuracy” was used.
To clarify, the ISO agreed accuracy should describe the total displacement from a reference value, and always cover both random and systematic effects. So, what to call the new third member of the triumvirate? Bias was mooted for a while, but that term carried a lot of baggage for assorted reasons, so, the term trueness was settled upon.
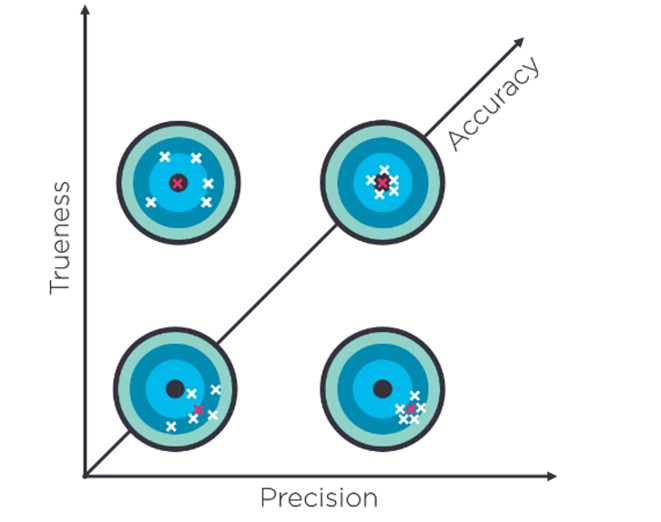
 Trueness, precision, and accuracy and their relationship.
However, the ISO 5725 is not made for 3D cameras or to characterize 3D measurement performance, there was another ISO for that as you saw in the previous section.
So how does it then relate to a robot vision system? Well, it is complicated, that’s why this is a four-part series and first, we need to set some context, so here goes.
Field-of-view (FOV) – the sampling grid
The field-of-view describes how much a camera sensor sees. It is the two-dimensional camera’s view of its world stretching in the horizontal and vertical directions. This is a pyramidal shape, known as a frustum, from the origin point in the camera optics to a given (model specific) max distance away from the camera. As the distance between the camera and the objects it is looking at increases, so does the base area and volume of the frustum. At a given distance, the size of the scene the imaging sensor sees (e.g., the size of the scene captured by all the pixels of the sensor), is covered by the area of the frustum at that distance.
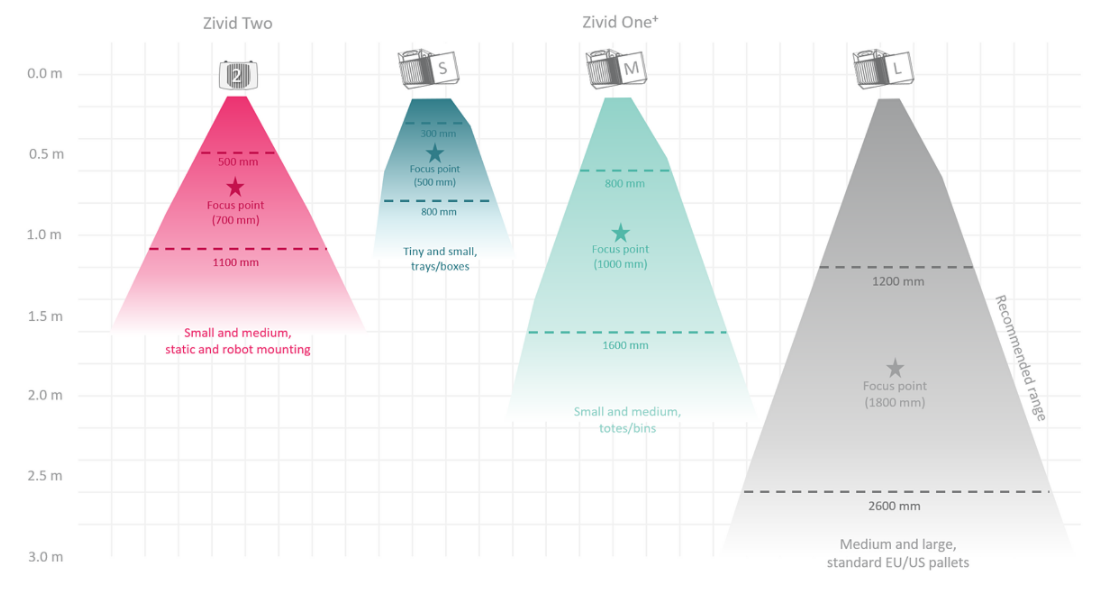
Illustrations of the horizontal field of view of the Zivid color 3D cameras.
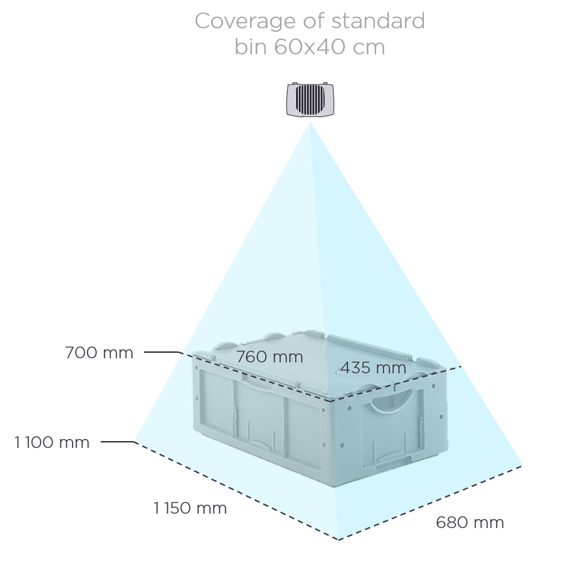
Showing the extent of the coverage of Zivid Two field-of-view at 700 mm and 1100 mm in the context of a regular picking application with a 60x40x40cm bin.
Sensor resolution
A 3D camera's sensor resolution is dependent on the number of pixels in the sensor. These represent the total number of sampling locations. So, a grid of 1920 x 1200 pixels offers a resolution sampling grid of 2.3 million pixels. A regular 2D camera will give RGB values for each of those pixels. A 3D camera differs in that it offers additional coordinate information in the X, Y, and Z axis, which represent a distance measurement from the origin inside the 3D camera to the surface of the objects you are imaging at each sampled point in space.
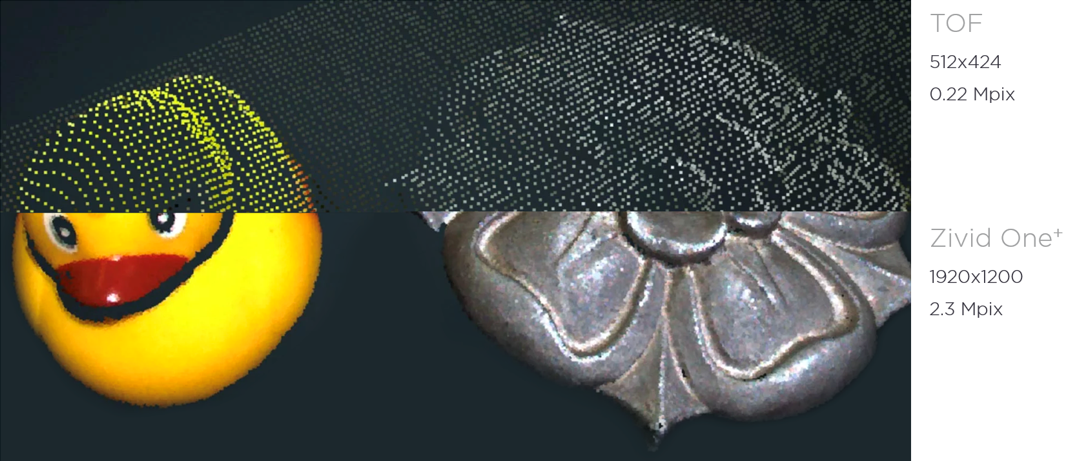
Illustration of the effect of increasing the sensor resolution, showing Zivid high-resolution 3D point cloud compared to a lower resolution Time-of-flight (TOF) camera of the same scene.
Spatial resolution
Each camera pixel measures the light of a small square region in the image plane which expands as the frustum extends and becomes bigger as the distance from the camera to the surface increases. Correspondingly the spatial resolution in the XY plane increases as the distance from the camera to the region of view increases.
Each of these square regions covered by an individual pixel is the spatial resolution at a given distance. As an example, The Zivid One+ camera operating at a working distance of 1 meter from the subject has a spatial resolution of 0.375 mm. We can see that this spatial resolution value at a given distance dictates the smallest feature measurement possible. The spatial resolution becomes smaller when moving closer, revealing smaller features. Moving farther away increases the spatial resolution, making the smallest features harder to distinguish. So, the number of pixels, the FOV, and the working distance determine the minimum feature extractable from our point clouds.
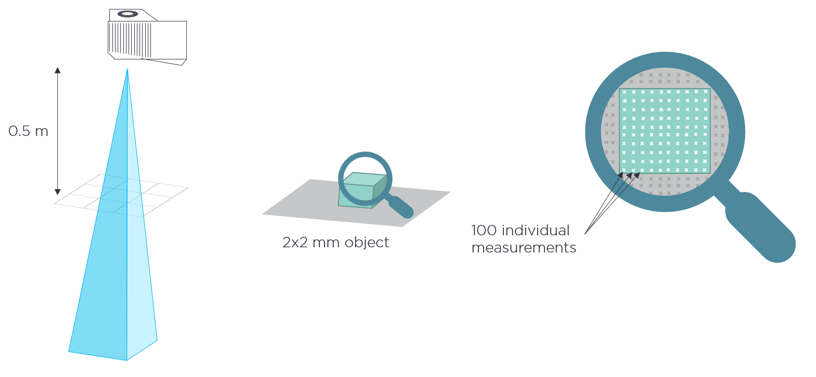
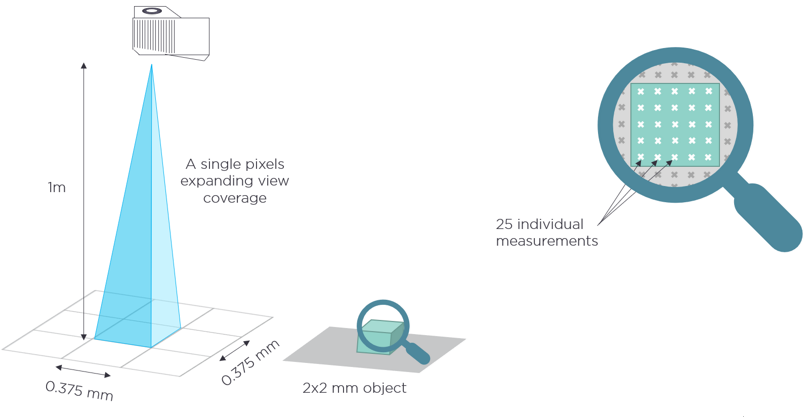
Spatial resolution difference at different distances.
What about depth resolution?
If you read online there are some that use the term depth resolution (or axial Z-resolution) in conjunction with a spatial resolution (or lateral XY-resolution) to describe 3D performance. Spatial resolution is relatively straightforward to understand, being determined by the physical pixels and FOV of the sensor, however, talking about depth resolution in the same consistent way is not equally straightforward. Logically, if we apply the same approach, then depth resolution should be the smallest distance we can resolve on the Z-axis, which would be related to the underlying measurement principle and the fundamental limitation of the sensing technology. But there’s a catch here.
How do you consistently define the fundamental limitation of the sensing technology in the presence of all the different noise sources (e.g., should only shot noise be included like in some articles)? Consequently, what is typically used is the total noise level of the depth measurement, the so called ‘z-noise’. The problem with this though is that when talking about measurement noise in the context of robotic automation, it’s the full 3D point cloud that’s important. The measurement at each pixel is therefore in three dimensions (X, Y, and Z), not only a depth measurement (Z). Understandably it doesn’t make good sense to talk about z-noise alone.
So, the correct way of doing it, and the way we have adopted at Zivid described in this blog series, is the following:
The sensor resolution gives you the sampling grid for your 3D measurements, and for each sampling location, the underlying surface points are measured in full 3D. Measurement variation, and the ability to resolve details in all three dimensions (X, Y, and Z), is then represented by Precision, a Euclidian distance, measured between consecutive measurements.
Part two about Trueness – Seeing the Details and Remaining True to Reality
We will look deeper into this, and cover what Precision and Trueness are and how they allow us to see the details, and how what we see measures up to reality.
This is a sample of our white paper "Achieving accuracy in vision-guided robotics". Read it here:
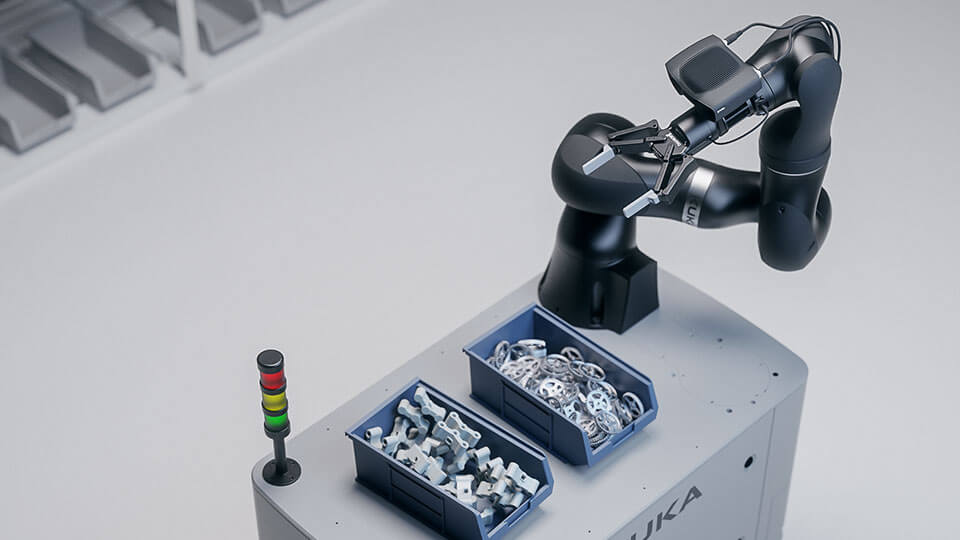
SECMA improves bin-picking with 3D vision
The new 3D vision tools enabling bin-picking automation